

Manual Trading Guide
One Tool compresses many classical indicators into a single canvas. It shows bias per timeframe, volatility rails for context, distribution balance, and clear entry and exit labels. The value is disciplined execution, not prediction.

Overview
Markets
Crypto, equities, indices, futures, FX where liquidity is sufficient
Timeframes
From one minute to one day, outputs adapt in real time
Positioning
Educational analytics, not advice, you remain in control
Who it serves
- Manual traders who want structure and repeatability
- Multi asset traders who prefer one workflow across markets
- Learners who want many signals boiled to one decision layer
Panels
Bias ratings
Conviction per timeframe as a percentage. Above fifty tilts bullish, below fifty tilts bearish. Alignment across chart, medium, and long horizons signals stronger conditions.
Volatility rails
Daily ATR based bands that frame expected movement. Use to place stops and targets with context and avoid chasing price outside range.
Distribution tiles
Small, mid, and long range percentages that reveal pressure balance. If one side dominates across ranges, fade trades against it or size smaller.
Entry and exit labels
Labels appear when conditions align. Treat them as discipline checkpoints inside your plan, not as instructions to copy.
Workflow
- Apply One Tool on your TradingView chart for the chosen asset
- Read bias across the three horizons and decide if conditions are aligned or choppy
- Check volatility rails and set stop and target within reason relative to current context
- Review distribution tiles to avoid trading directly into dominant pressure
- Use labels as a final discipline check before execution and logging
Risk and sizing
- All outputs are context, not guarantees
- Size relative to volatility. Wider rails mean smaller position size
- Respect a fixed risk per trade based on your plan
- Track your Discipline Score and learn from deviations
TradingView setup
- Use dark theme for clarity and parity with the site
- Hide other indicators when reading bias to reduce noise
- Save layouts by asset class for faster switching
- Prefer liquid symbols and clean exchange feeds
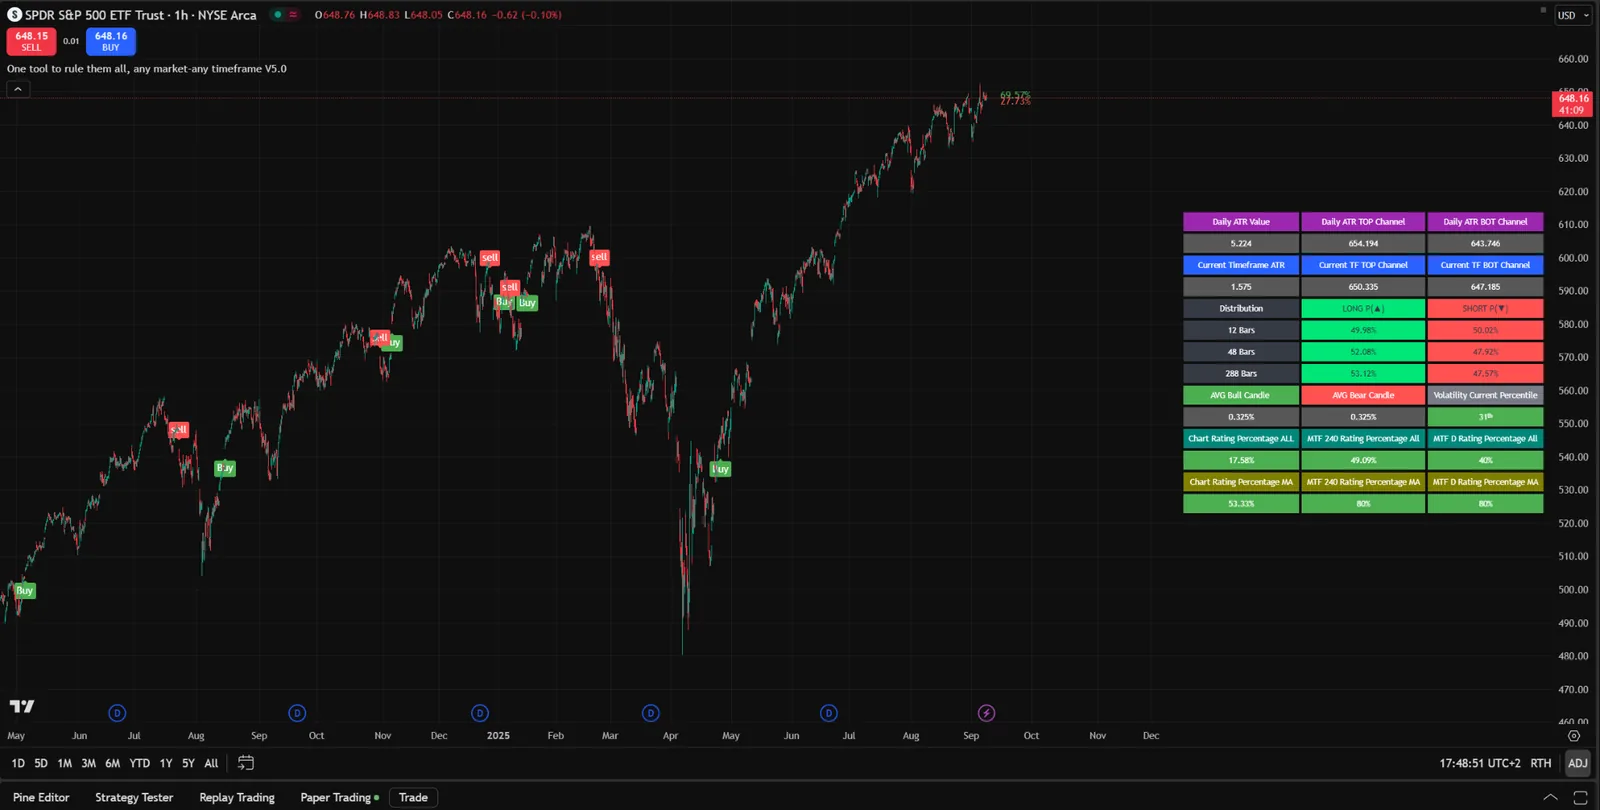
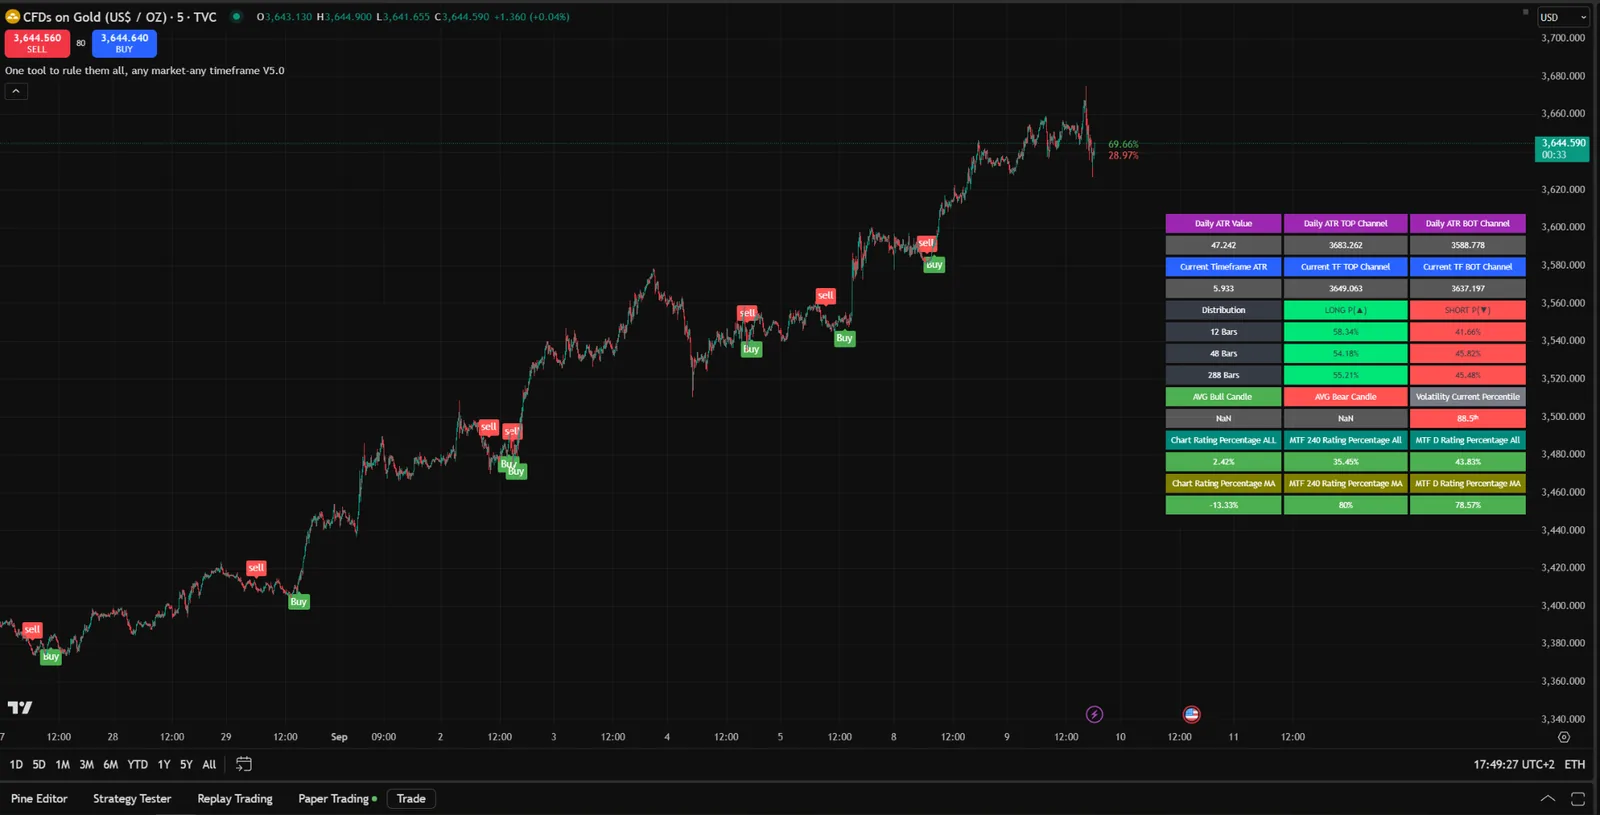
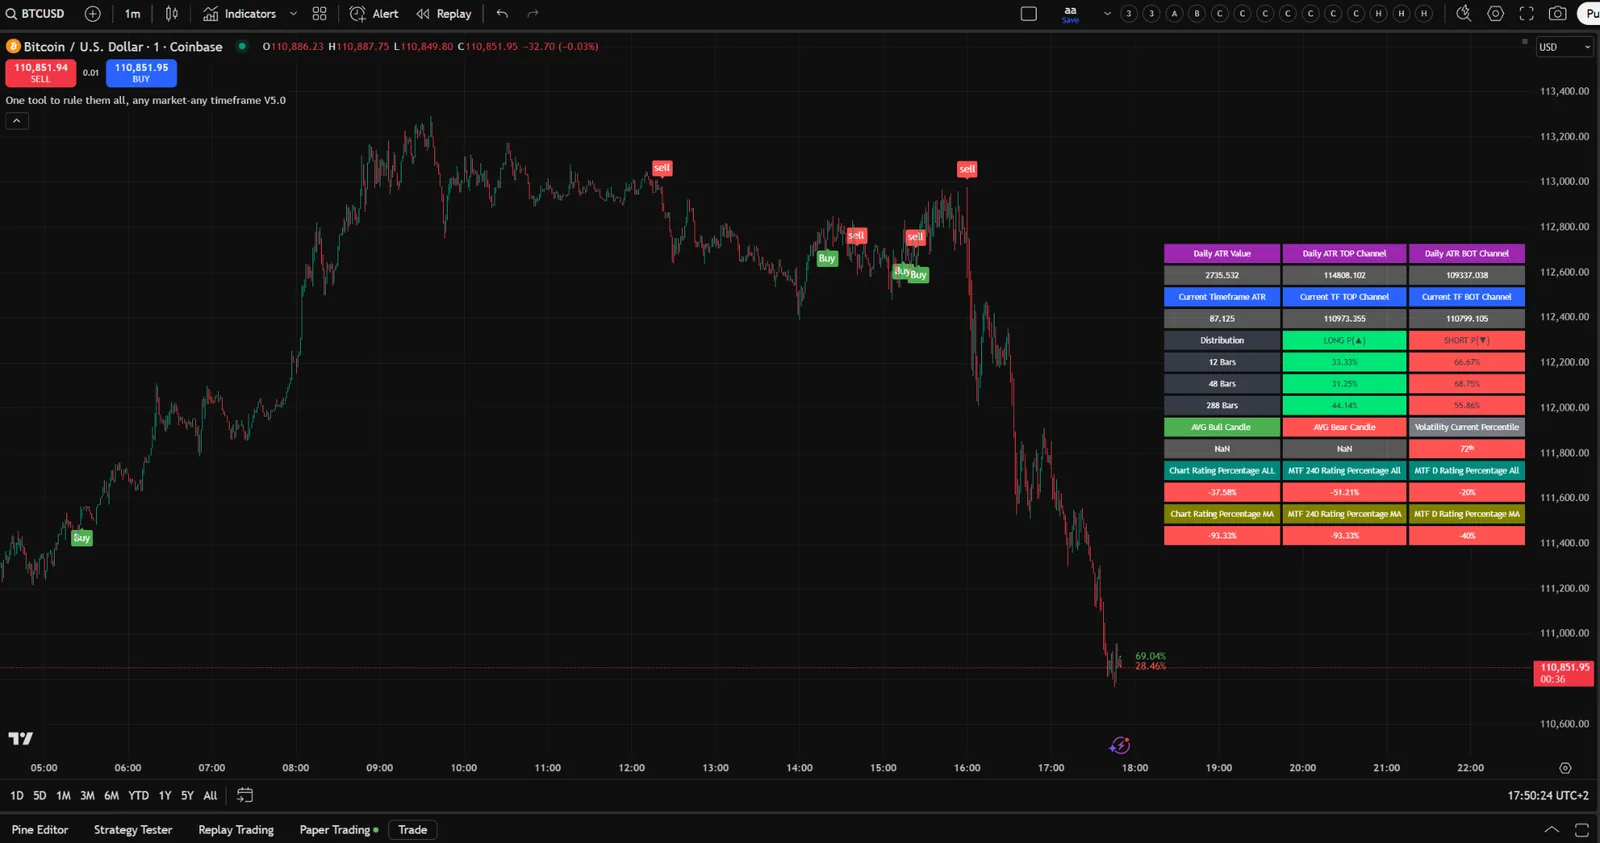
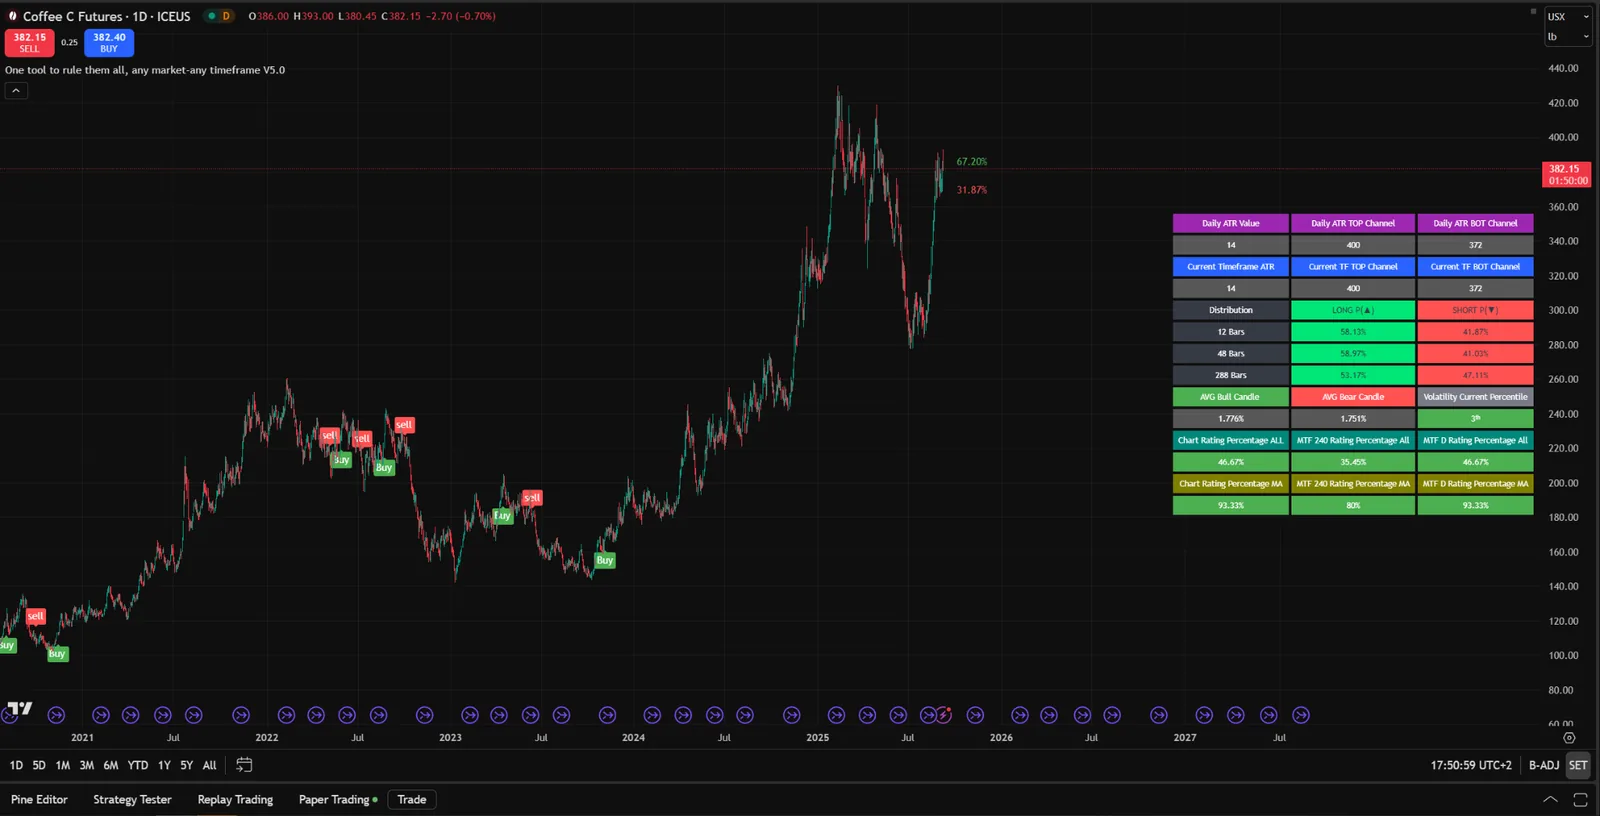
Examples
Real screenshots with the panel visible. Same logic, different markets and timeframes.
FAQ
Does it give buy or sell markers?
Yes — the framework can plot markers when certain conditions are met. These are educational checkpoints that illustrate how the model behaves, not recommendations. You remain responsible for your own trading decisions.
Which assets are supported?
Crypto, equities, indices, futures, and FX — as long as data is reliable and liquidity is sufficient.
Can I use it on any timeframe?
Yes. Ratings and rails adapt from one minute to one day. Shorter frames require tighter risk controls and smaller position sizes.
How does the Discipline Score™ fit in?
It increases when you follow your plan, respect stops, and size correctly, and it decreases when you deviate. It is designed as a personal feedback loop, not a profit measure.
Compliance
Educational analytics and model signals. No personalized investment advice. We do not assess suitability, we do not execute trades, and we do not hold client assets. You are responsible for your decisions, sizing, and execution.
This product is offered as research and software access. Payments via Stripe or crypto are for software and educational content, not for investment services. Taxes and refunds are handled by Stripe where applicable. Crypto payments may be subject to basic AML checks.
Built with European regulatory context in mind and framed as education and research. Nothing here should be interpreted as a solicitation to engage in specific transactions.
Professional-Grade Algorithmic Strategies
Unlock disciplined frameworks engineered to withstand volatility, benchmarked transparently, and updated with integrity. Every model is delivered with equity curves, rules, and methodology.
Clear rules and guardrails, documented methodology
Live equity curves and benchmark comparison
Update cadence and transparency archive
Models are educational demonstrations on market data. They are not investment advice or personalized recommendations.