

Hercules Volatility Guide
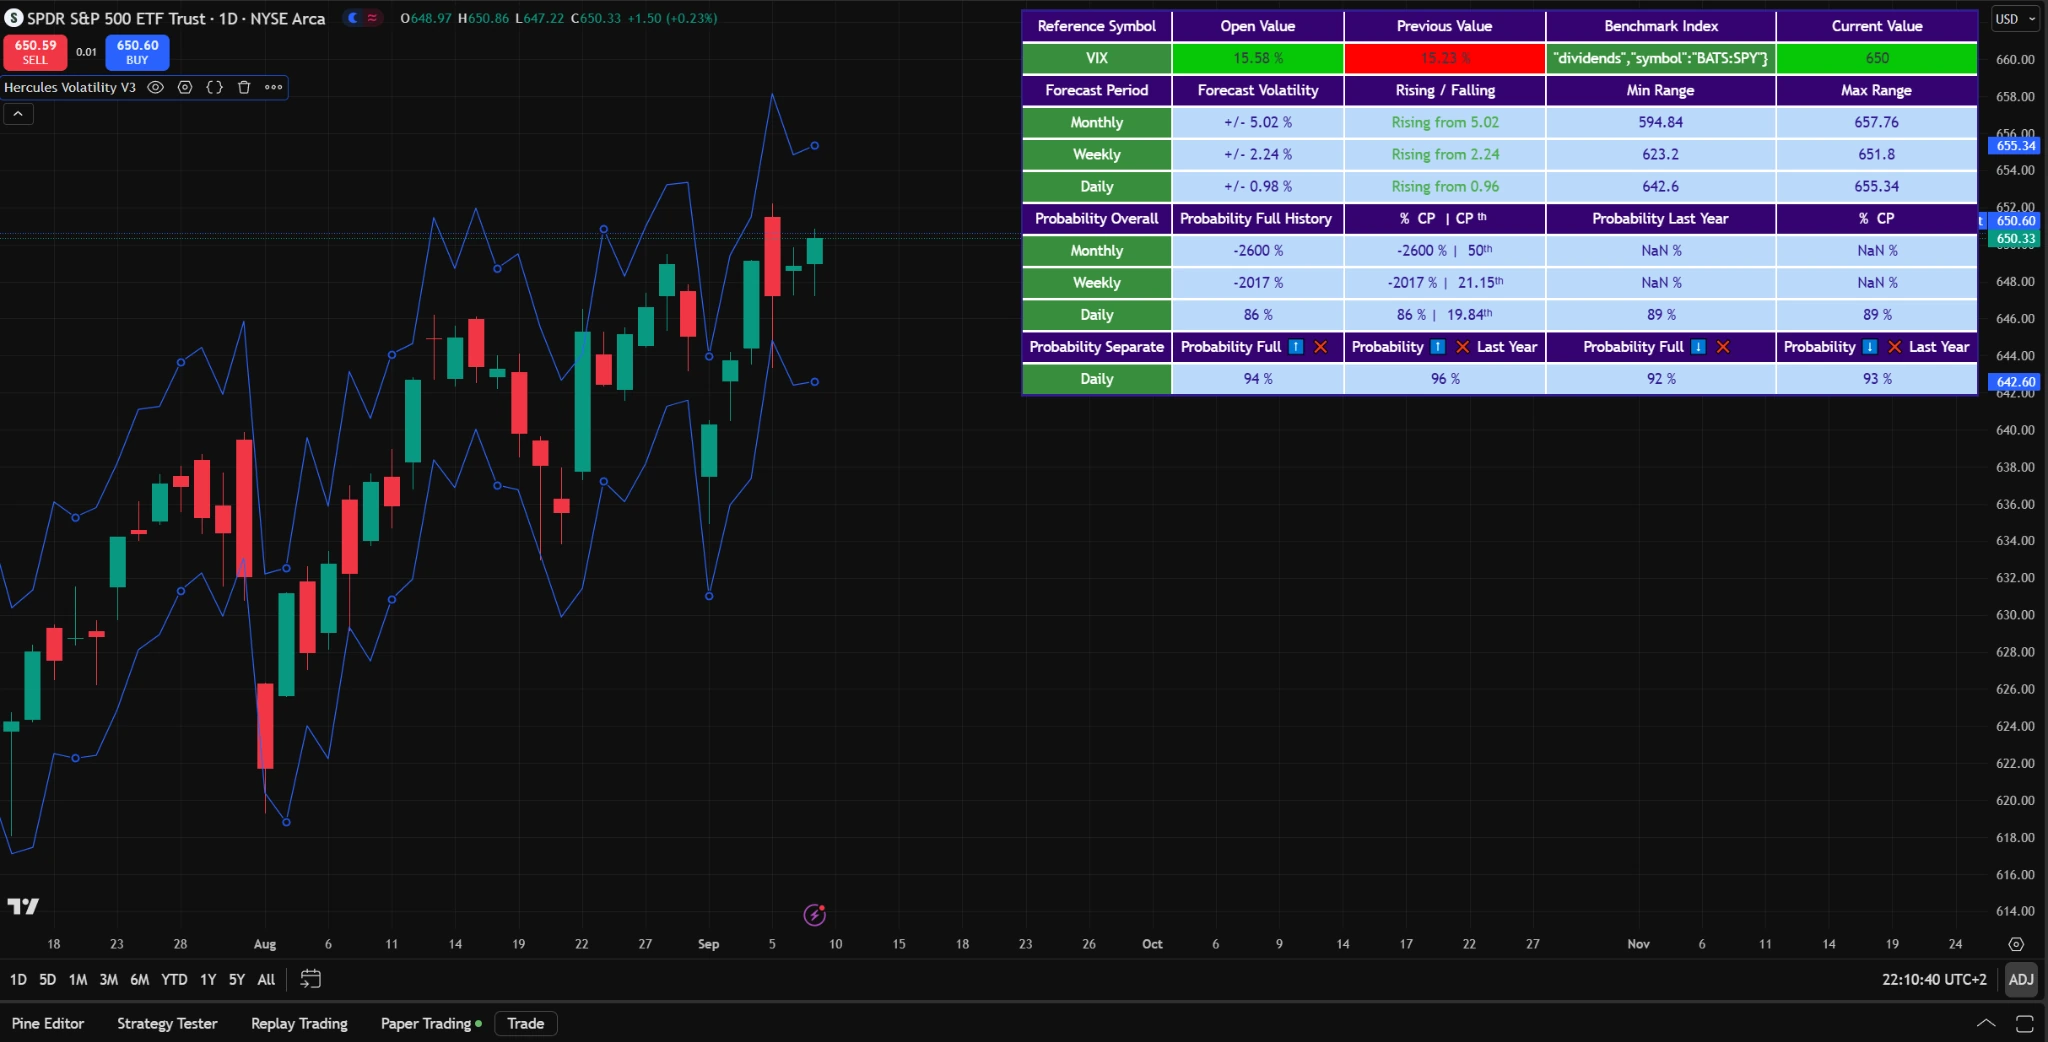
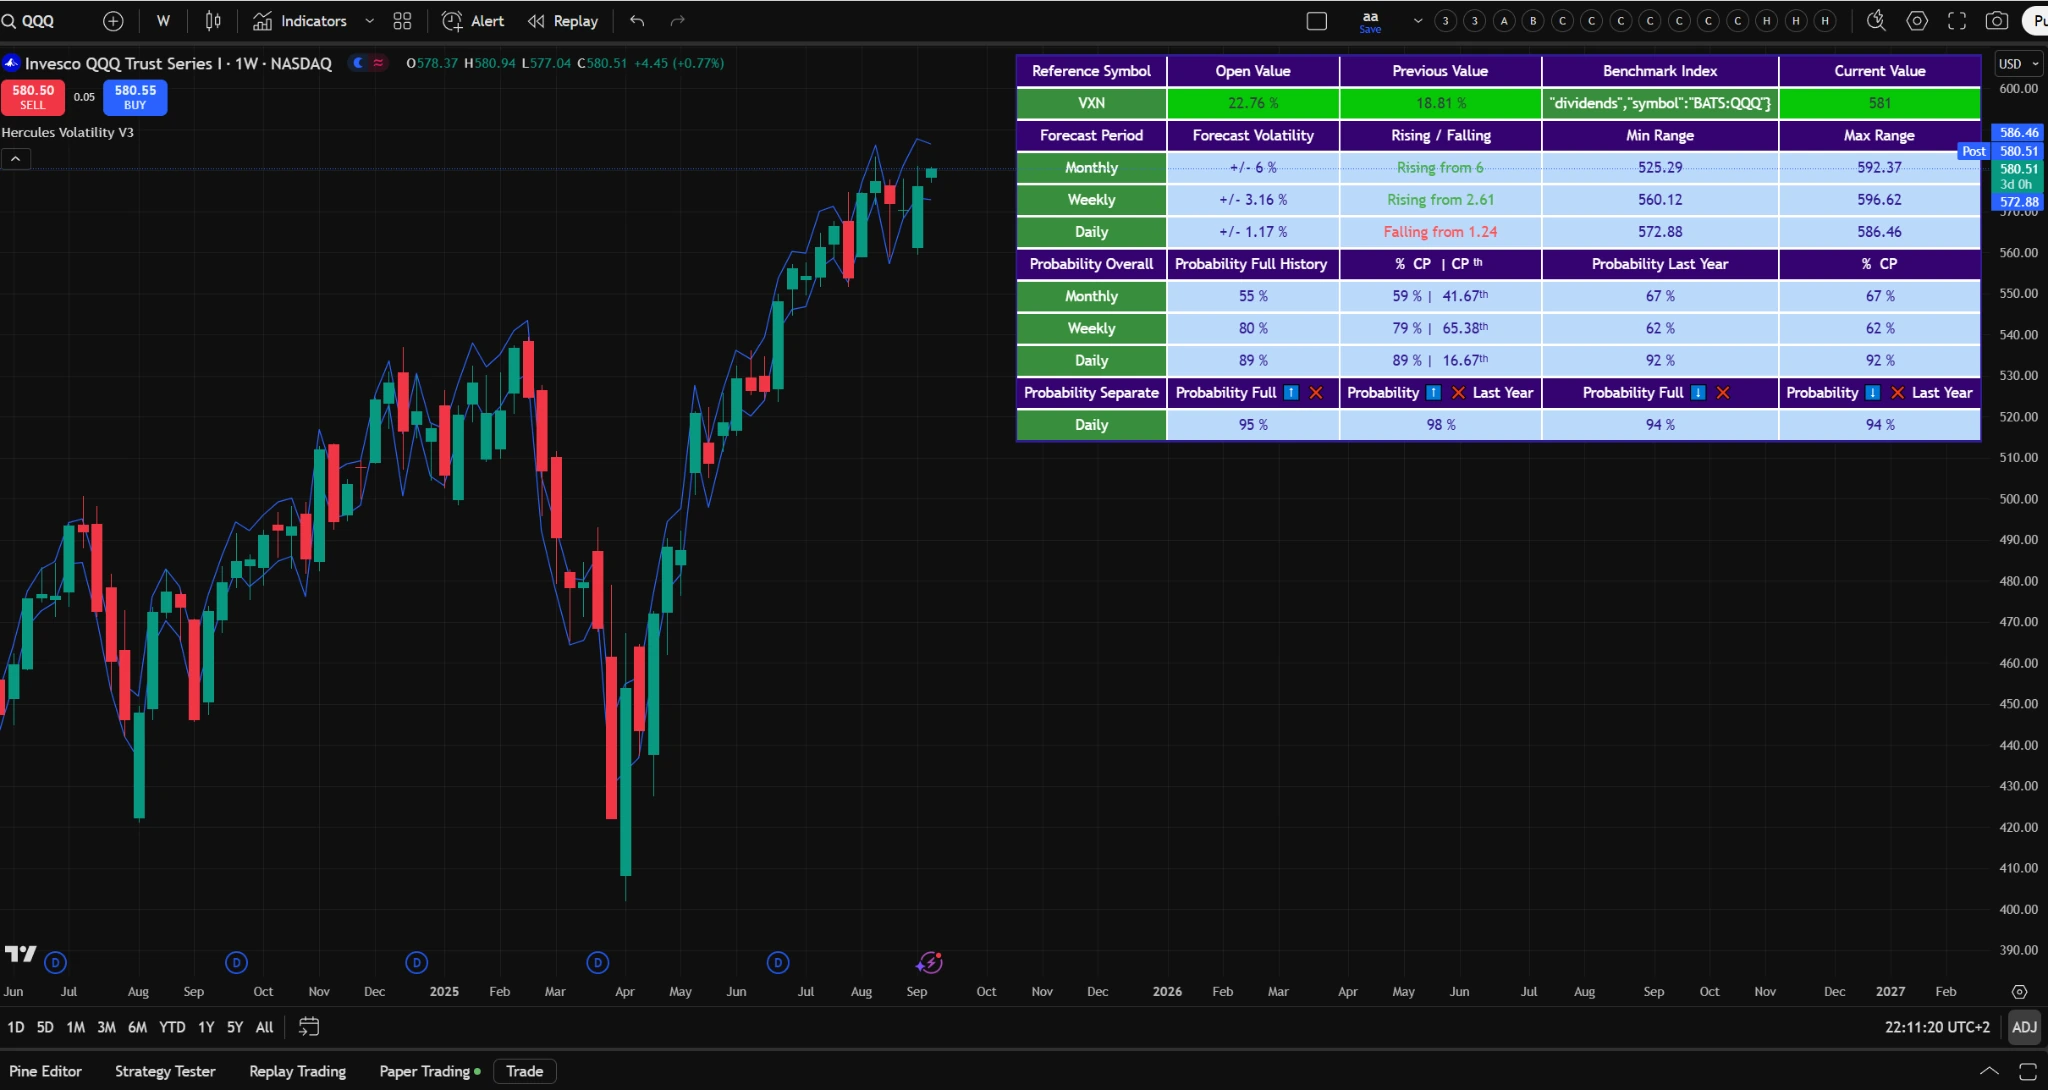
The model anchors on a volatility symbol like VIX or VXN. It derives annual volatility from the open, then scales it to quarter, month, week, day, and hour. Those levels define expected rails for the traded index or asset and feed probability tiles for range breaches under rising or falling volatility states. Percentile windows and a year filter refine the context.

Overview
Comparative symbol
VIX for SPX, VXN for NASDAQ, or any suitable volatility proxy
Rails
Daily to monthly ranges derived from the volatility open and scaled by multiplier
Probabilities
Breach rates under rising or falling volatility, with optional percentile and time filters
Mechanics
Inputs from the volatility anchor
The model reads open values of the selected volatility symbol on daily, weekly, and monthly frames. It derives annual volatility, then scales it to quarter, month, week, day, and hour using square root of time.
Expected range rails
From the index open or current value it computes min and max range for each timeframe. Rails update as volatility changes.
Probability tiles
It classifies volatility as rising or falling relative to the prior period, then tracks how often price breached the expected range. It reports full history and last year, plus percentile filtered variants.
Percentile context
Current percentile of volatility on daily, weekly, and monthly frames helps decide if conditions are stretched. Windows are configurable to focus on normal or extreme regimes.
Inputs
volatility_ticker
Default VIX. Use VXN for NASDAQ. Choose a symbol that matches your traded index or asset class.
multiplier
Scales the volatility based rails. Start at one, adjust after journal review.
anyo
Backtest start year for the last year views and time filters.
percentile_input and percentile_input_max
Window for filtering the probability tiles by current percentile of volatility.
TableLocation and TableTextSize
Display controls for the table on chart.
Workflow
- Select the correct volatility anchor for the asset you plan to trade.
- Read the percentile of current volatility and the direction state rising or falling.
- Check rails and breach probabilities for full history and last year on the timeframe you trade.
- For options selling around thirty to forty five days to expiry, place strikes outside the rails when feasible and align with the direction cue.
- Size by volatility. When rails expand and breach risk rises, reduce size or wait. When rails contract and probabilities improve, consider normal size with strict stops.
- Log decisions and update the Discipline Score.
Risk and sizing
- All outputs are context, not guarantees.
- Respect fixed risk per trade and portfolio wide limits.
- Avoid initiating new risk at extreme percentiles unless your plan requires it.
- Use liquid underlyings and clean exchange feeds.
TradingView setup
- Apply the indicator on the traded symbol and set the volatility ticker to VIX or VXN as needed.
- Use dark theme for parity with the site and clarity of the table.
- Save layouts per asset class for faster switching.
- Hide unrelated indicators when reading probabilities.
FAQ
Does it tell me when to buy or sell
No. It provides educational analytics and context. You decide entries and exits inside your plan.
Which assets are supported
Equities, indices, futures, FX where data is reliable and liquid. Use the appropriate volatility anchor.
What about options selling
The model assists with context for options selling around thirty to forty five days. It never replaces your plan.
How does the Discipline Score work
It increases when you follow your plan, respect stops, and size correctly, and decreases when you deviate. It is a behavior loop.
Examples
Screens with the probability table visible.
Compliance
Educational analytics and model signals. No personalized investment advice. We do not assess suitability, we do not execute trades, and we do not hold client assets. You are responsible for your decisions, sizing, and execution.
This product is offered as research and software access. Payments via Stripe or crypto are for software and educational content, not for investment services. Taxes and refunds are handled by Stripe where applicable. Crypto payments may be subject to basic AML checks.
Built with European regulatory context in mind and framed as education and research. Nothing here should be interpreted as a solicitation to engage in specific transactions.
Professional-Grade Algorithmic Strategies
Unlock disciplined frameworks engineered to withstand volatility, benchmarked transparently, and updated with integrity. Every model is delivered with equity curves, rules, and methodology.
Clear rules and guardrails, documented methodology
Live equity curves and benchmark comparison
Update cadence and transparency archive
Models are educational demonstrations on market data. They are not investment advice or personalized recommendations.